Note
Click here to download the full example code
Basic Methods
The covariance model class CovModel of GSTools provides a set of handy
methods.
One of the following functions defines the main characterization of the variogram:
CovModel.variogram: The variogram of the model given by
CovModel.covariance: The (auto-)covariance of the model given by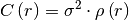
CovModel.correlation: The (auto-)correlation (or normalized covariance) of the model given by
CovModel.cor: The normalized correlation taking a normalized range given by: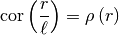
As you can see, it is the easiest way to define a covariance model by giving a correlation function as demonstrated in the introductory example. If one of the above functions is given, the others will be determined:
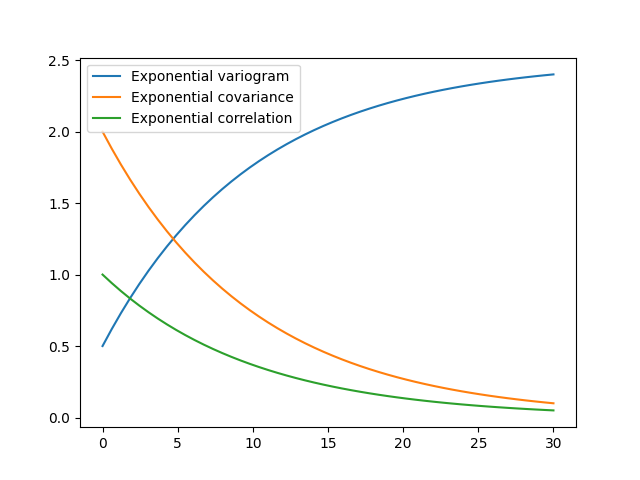
import gstools as gs

model = gs.Exponential(dim=3, var=2.0, len_scale=10, nugget=0.5)
ax = model.plot("variogram")
model.plot("covariance", ax=ax)
model.plot("correlation", ax=ax)
Total running time of the script: ( 0 minutes 0.113 seconds)