Note
Click here to download the full example code
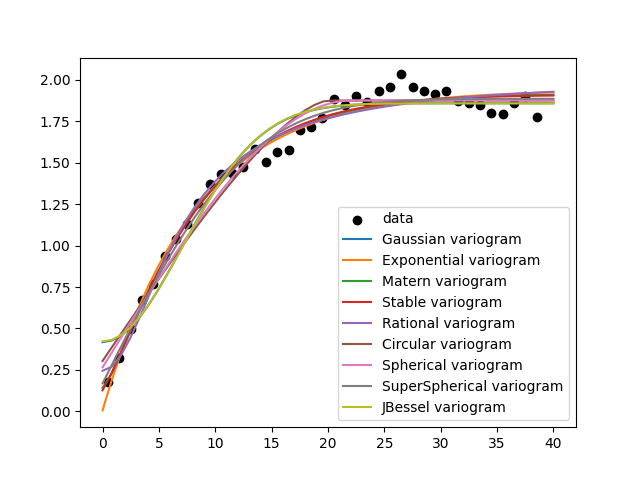
Finding the best fitting variogram model
import numpy as np
from matplotlib import pyplot as plt

import gstools as gs
Generate a synthetic field with an exponential model.
x = np.random.RandomState(19970221).rand(1000) * 100.0
y = np.random.RandomState(20011012).rand(1000) * 100.0
model = gs.Exponential(dim=2, var=2, len_scale=8)
srf = gs.SRF(model, mean=0, seed=19970221)
field = srf((x, y))
Estimate the variogram of the field with 40 bins and plot the result.
bins = np.arange(40)
bin_center, gamma = gs.vario_estimate((x, y), field, bins)
Define a set of models to test.
models = {
    "Gaussian": gs.Gaussian,
    "Exponential": gs.Exponential,
    "Matern": gs.Matern,
    "Stable": gs.Stable,
    "Rational": gs.Rational,
    "Circular": gs.Circular,
    "Spherical": gs.Spherical,
    "SuperSpherical": gs.SuperSpherical,
    "JBessel": gs.JBessel,
}
scores = {}
Iterate over all models, fit their variogram and calculate the r2 score.
# plot the estimated variogram
plt.scatter(bin_center, gamma, color="k", label="data")
ax = plt.gca()

# fit all models to the estimated variogram
for model in models:
    fit_model = models[model](dim=2)
    para, pcov, r2 = fit_model.fit_variogram(bin_center, gamma, return_r2=True)
    fit_model.plot(x_max=40, ax=ax)
    scores[model] = r2
Create a ranking based on the score and determine the best models
ranking = sorted(scores.items(), key=lambda item: item[1], reverse=True)
print("RANKING by Pseudo-r2 score")
for i, (model, score) in enumerate(ranking, 1):
    print(f"{i:>6}. {model:>15}: {score:.5}")

plt.show()
RANKING by Pseudo-r2 score
     1.          Stable: 0.98218
     2.          Matern: 0.98176
     3.  SuperSpherical: 0.98141
     4.     Exponential: 0.98041
     5.        Rational: 0.97711
     6.       Spherical: 0.97334
     7.        Circular: 0.96725
     8.        Gaussian: 0.95928
     9.         JBessel: 0.95831
Total running time of the script: ( 0 minutes 1.102 seconds)