Note
Go to the end to download the full example code.
GSTools Interface
Example how to use the PyKrige routines with a GSTools CovModel.
import gstools as gs
import numpy as np
from matplotlib import pyplot as plt
from pykrige.ok import OrdinaryKriging
# conditioning data
data = np.array(
[
[0.3, 1.2, 0.47],
[1.9, 0.6, 0.56],
[1.1, 3.2, 0.74],
[3.3, 4.4, 1.47],
[4.7, 3.8, 1.74],
]
)
# grid definition for output field
gridx = np.arange(0.0, 5.5, 0.1)
gridy = np.arange(0.0, 6.5, 0.1)
# a GSTools based covariance model
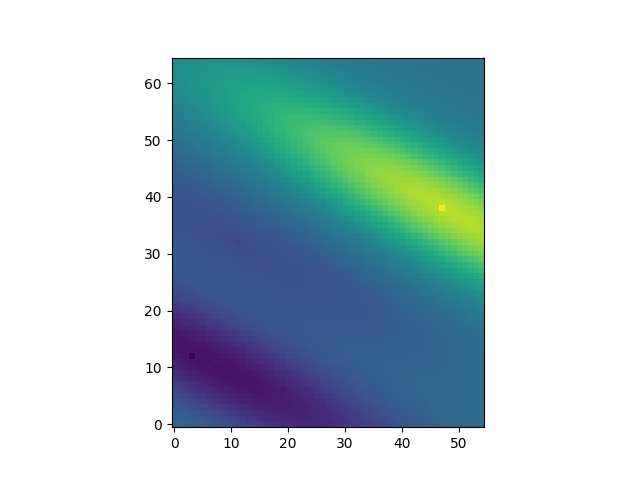
cov_model = gs.Gaussian(dim=2, len_scale=4, anis=0.2, angles=-0.5, var=0.5, nugget=0.1)
# ordinary kriging with pykrige
OK1 = OrdinaryKriging(data[:, 0], data[:, 1], data[:, 2], cov_model)
z1, ss1 = OK1.execute("grid", gridx, gridy)
plt.imshow(z1, origin="lower")
plt.show()
Total running time of the script: (0 minutes 0.050 seconds)