Note
Click here to download the full example code
Finding the best fitting variogram model
import numpy as np
import gstools as gs
from matplotlib import pyplot as plt
Generate a synthetic field with an exponential model.
x = np.random.RandomState(19970221).rand(1000) * 100.0
y = np.random.RandomState(20011012).rand(1000) * 100.0
model = gs.Exponential(dim=2, var=2, len_scale=8)
srf = gs.SRF(model, mean=0, seed=19970221)
field = srf((x, y))
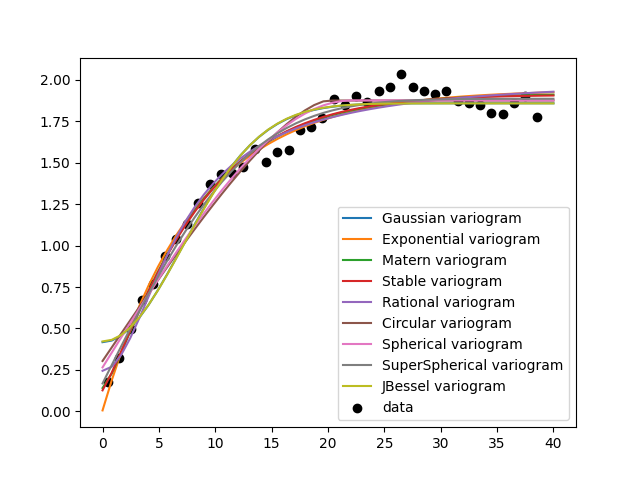
Estimate the variogram of the field with 40 bins and plot the result.
bins = np.arange(40)
bin_center, gamma = gs.vario_estimate((x, y), field, bins)
Define a set of models to test.
models = {
    "Gaussian": gs.Gaussian,
    "Exponential": gs.Exponential,
    "Matern": gs.Matern,
    "Stable": gs.Stable,
    "Rational": gs.Rational,
    "Circular": gs.Circular,
    "Spherical": gs.Spherical,
    "SuperSpherical": gs.SuperSpherical,
    "JBessel": gs.JBessel,
}
scores = {}
Iterate over all models, fit their variogram and calculate the r2 score.
# plot the estimated variogram
plt.scatter(bin_center, gamma, color="k", label="data")
ax = plt.gca()

# fit all models to the estimated variogram
for model in models:
    fit_model = models[model](dim=2)
    para, pcov, r2 = fit_model.fit_variogram(bin_center, gamma, return_r2=True)
    fit_model.plot(x_max=40, ax=ax)
    scores[model] = r2
Create a ranking based on the score and determine the best models
ranking = [
    (k, v)
    for k, v in sorted(scores.items(), key=lambda item: item[1], reverse=True)
]
print("RANKING")
for i, (model, score) in enumerate(ranking, 1):
    print(i, model, score)

plt.show()
Out:
RANKING
1 Stable 0.9821836193000343
2 Matern 0.9817602690672453
3 SuperSpherical 0.9814051618626767
4 Exponential 0.980407470735337
5 Rational 0.9771067080321653
6 Spherical 0.9733371670897375
7 Circular 0.9672526098783125
8 Gaussian 0.9592818084007272
9 JBessel 0.9583119496108051
Total running time of the script: ( 0 minutes 1.002 seconds)