gstools.variogram.vario_estimate
- gstools.variogram.vario_estimate(pos, field, bin_edges=None, sampling_size=None, sampling_seed=None, estimator='matheron', latlon=False, direction=None, angles=None, angles_tol=0.39269908169872414, bandwidth=None, no_data=nan, mask=False, mesh_type='unstructured', return_counts=False, mean=None, normalizer=None, trend=None, fit_normalizer=False)[source]
Estimates the empirical variogram.
The algorithm calculates following equation:
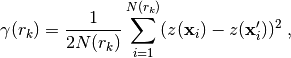
with
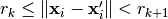 being the bins.
Or if the estimator “cressie” was chosen:
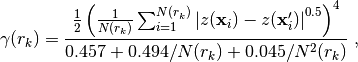
with
being the bins.
The Cressie estimator is more robust to outliers [Webster2007].By provding direction vector[s] or angles, a directional variogram can be calculated. If multiple directions are given, a set of variograms will be returned. Directional bining is controled by a given angle tolerance (angles_tol) and an optional bandwidth, that truncates the width of the search band around the given direction[s].
To reduce the calcuation time, sampling_size could be passed to sample down the number of field points.
- Parameters
pos (
list) – the position tuple, containing either the point coordinates (x, y, …) or the axes descriptions (for mesh_type=’structured’)field (
numpy.ndarrayorlistofnumpy.ndarray) – The spatially distributed data. Can also be of typenumpy.ma.MaskedArrayto use masked values. You can pass a list of fields, that will be used simultaneously. This could be helpful, when there are multiple realizations at the same points, with the same statistical properties.bin_edges (
numpy.ndarray, optional) – the bins on which the variogram will be calculated. IfNoneare given, standard bins provided by thestandard_binsroutine will be used. Default:Nonesampling_size (
intorNone, optional) – for large input data, this method can take a long time to compute the variogram, therefore this argument specifies the number of data points to sample randomly Default:Nonesampling_seed (
intorNone, optional) – seed for samples if sampling_size is given. Default:Noneestimator (
str, optional) –the estimator function, possible choices:
”matheron”: the standard method of moments of Matheron
”cressie”: an estimator more robust to outliers
Default: “matheron”
latlon (
bool, optional) – Whether the data is representing 2D fields on earths surface described by latitude and longitude. When using this, the estimator will use great-circle distance for variogram estimation. Note, that only an isotropic variogram can be estimated and a ValueError will be raised, if a direction was specified. Bin edges need to be given in radians in this case. Default: Falsedirection (
listofnumpy.ndarray, optional) – directions to evaluate a directional variogram. Anglular tolerance is given by angles_tol. bandwidth to cut off how wide the search for point pairs should be is given by bandwidth. You can provide multiple directions at once to get one variogram for each direction. For a single direction you can also use the angles parameter, to provide the direction by its spherical coordianates. Default:Noneangles (
numpy.ndarray, optional) – the angles of the main axis to calculate the variogram for in radians angle definitions from ISO standard 80000-2:2009 for 1d this parameter will have no effect at all for 2d supply one angle which is azimuth (ccw from +x in xy plane)
for 3d supply two angles which are
azimuth (ccw from +x in xy plane)
and inclination
(ccw from +x in xy plane)
for 3d supply two angles which are
azimuth (ccw from +x in xy plane)
and inclination  (cw from +z).
Can be used instead of direction.
Default:
(cw from +z).
Can be used instead of direction.
Default: Noneangles_tol (class:float, optional) – the tolerance around the variogram angle to count a point as being within this direction from another point (the angular tolerance around the directional vector given by angles) Default: np.pi/8 = 22.5°
bandwidth (class:float, optional) – bandwidth to cut off the angular tolerance for directional variograms. If None is given, only the angles_tol parameter will control the point selection. Default:
Noneno_data (
float, optional) – Value to identify missing data in the given field. Default: numpy.nanmask (
numpy.ndarrayofbool, optional) – Mask to deselect data in the given field. Default:numpy.ma.nomaskmesh_type (
str, optional) – ‘structured’ / ‘unstructured’, indicates whether the pos tuple describes the axis or the point coordinates. Default: ‘unstructured’return_counts (
bool, optional) – if set to true, this function will also return the number of data points found at each lag distance as a third return value Default: Falsemean (
float, optional) – mean value used to shift normalized input data. Can also be a callable. The default is None.normalizer (
NoneorNormalizer, optional) – Normalizer to be applied to the input data to gain normality. The default is None.trend (
Noneorfloatorcallable, optional) – A callable trend function. Should have the signiture: f(x, [y, z, …]) If no normalizer is applied, this behaves equal to ‘mean’. The default is None.fit_normalizer (
bool, optional) – Wheater to fit the data-normalizer to the given (detrended) field. Default: False
- Returns
bin_center ((n),
numpy.ndarray) – The bin centers.gamma ((n) or (d, n),
numpy.ndarray) – The estimated variogram values at bin centers. Is stacked if multiple directions (d>1) are given.counts ((n) or (d, n),
numpy.ndarray, optional) – The number of point pairs found for each bin. Is stacked if multiple directions (d>1) are given. Only provided if return_counts is True.normalizer (
Normalizer, optional) – The fitted normalizer for the given data. Only provided if fit_normalizer is True.
Notes
Internally uses double precision and also returns doubles.
References
- Webster2007
Webster, R. and Oliver, M. A. “Geostatistics for environmental scientists.”, John Wiley & Sons. (2007)