Note
Go to the end to download the full example code.
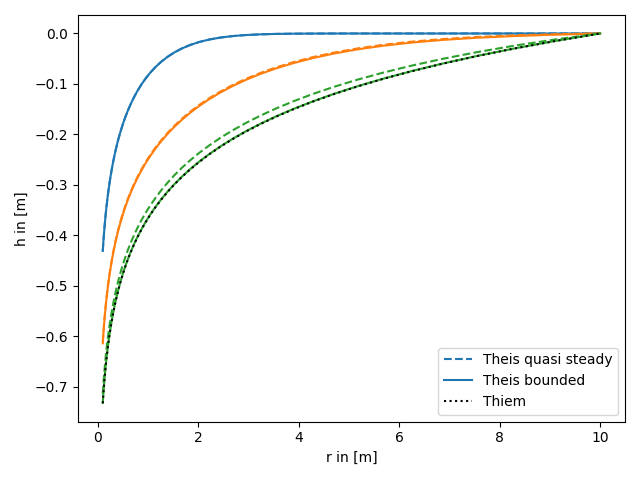
Quasi steady convergence
The quasi steady is reached, when the radial shape of the drawdown in not changing anymore.
import numpy as np
from matplotlib import pyplot as plt

from anaflow import theis, thiem

time = [10, 100, 1000]
rad = np.geomspace(0.1, 10)
r_ref = 10.0

head_ref = theis(
    time,
    np.full_like(rad, r_ref),
    storage=1e-3,
    transmissivity=1e-4,
    rate=-1e-4,
)
head1 = theis(time, rad, storage=1e-3, transmissivity=1e-4, rate=-1e-4) - head_ref
head2 = theis(time, rad, storage=1e-3, transmissivity=1e-4, rate=-1e-4, r_bound=r_ref)
head3 = thiem(rad, r_ref, transmissivity=1e-4, rate=-1e-4)

for i, step in enumerate(time):
    label_1 = "Theis quasi steady" if i == 0 else None
    label_2 = "Theis bounded" if i == 0 else None
    plt.plot(rad, head1[i], label=label_1, color="C" + str(i), linestyle="--")
    plt.plot(rad, head2[i], label=label_2, color="C" + str(i))

plt.plot(rad, head3, label="Thiem", color="k", linestyle=":")

plt.xlabel("r in [m]")
plt.ylabel("h in [m]")
plt.legend()
plt.tight_layout()
plt.show()
Total running time of the script: (0 minutes 0.178 seconds)