Note
Go to the end to download the full example code.
Generating Fields on Meshes
GSTools provides an interface for meshes, to support meshio and ogs5py meshes.
When using meshio, the generated fields will be stored immediately in the mesh container.
There are two options to generate a field on a given mesh:
points=”points” will generate a field on the mesh points
points=”centroids” will generate a field on the cell centroids
In this example, we will generate a simple mesh with the aid of meshzoo.
Now we prepare the SRF class as always. We will generate an ensemble of fields on the generated mesh.
# number of fields
fields_no = 12
# model setup
model = gs.Gaussian(dim=2, len_scale=0.5)
srf = gs.SRF(model, mean=1)
To generate fields on a mesh, we provide a separate method: SRF.mesh.
First we generate fields on the mesh-centroids controlled by a seed.
You can specify the field name by the keyword name.
for i in range(fields_no):
    srf.mesh(mesh, points="centroids", name=f"c-field-{i}", seed=i)
Now we generate fields on the mesh-points again controlled by a seed.
for i in range(fields_no):
    srf.mesh(mesh, points="points", name=f"p-field-{i}", seed=i)
To get an impression we now want to plot the generated fields. Luckily, matplotlib supports triangular meshes.
triangulation = tri.Triangulation(points[:, 0], points[:, 1], cells)
# figure setup
cols = 4
rows = int(np.ceil(fields_no / cols))
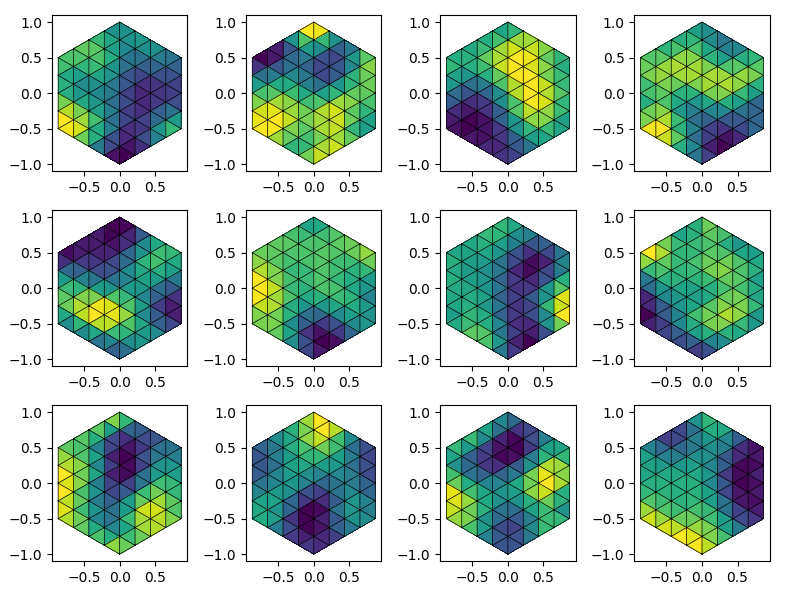
Cell data can be easily visualized with matplotlibs tripcolor. To highlight the cell structure, we use triplot.
fig = plt.figure(figsize=[2 * cols, 2 * rows])
for i, field in enumerate(mesh.cell_data, 1):
    ax = fig.add_subplot(rows, cols, i)
    ax.tripcolor(triangulation, mesh.cell_data[field][0])
    ax.triplot(triangulation, linewidth=0.5, color="k")
    ax.set_aspect("equal")
fig.tight_layout()
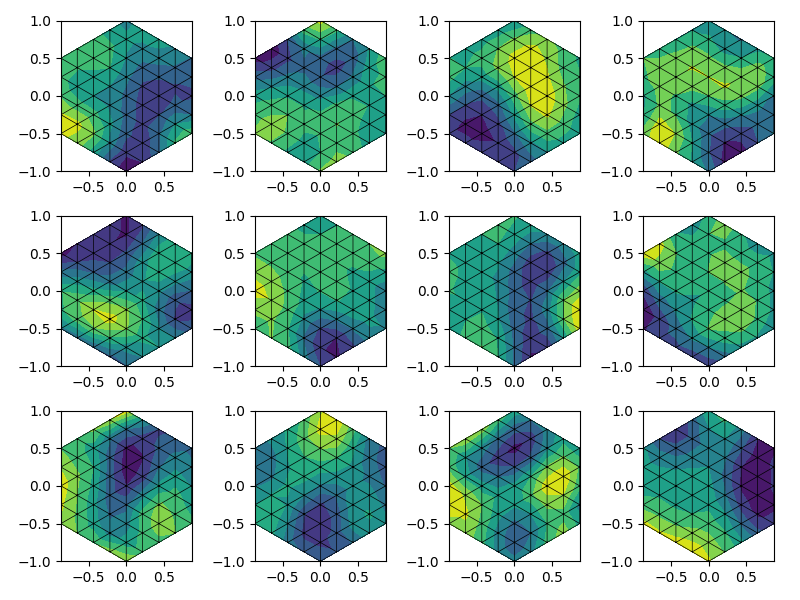
Point data is plotted via tricontourf.
fig = plt.figure(figsize=[2 * cols, 2 * rows])
for i, field in enumerate(mesh.point_data, 1):
    ax = fig.add_subplot(rows, cols, i)
    ax.tricontourf(triangulation, mesh.point_data[field])
    ax.triplot(triangulation, linewidth=0.5, color="k")
    ax.set_aspect("equal")
fig.tight_layout()
plt.show()
Last but not least, meshio can be used for what is does best: Exporting. Tada!
mesh.write("mesh_ensemble.vtk")
Warning: VTK requires 3D points, but 2D points given. Appending 0 third
component.
Total running time of the script: (0 minutes 0.925 seconds)