Note
Go to the end to download the full example code.
Normalizer Comparison
Let’s compare the transformation behavior of the provided normalizers.
But first, we define a convenience routine and make some imports as always.
import matplotlib.pyplot as plt
import numpy as np

import gstools as gs


def dashes(i=1, max_n=12, width=1):
    """Return line dashes."""
    return i * [width, width] + [max_n * 2 * width - 2 * i * width, width]
We select 4 normalizers depending on a single parameter lambda and plot their transformation behavior within the interval [-5, 5].
For the shape parameter lambda, we create a list of 8 values ranging from -1 to 2.5.
lmbdas = [i * 0.5 for i in range(-2, 6)]
normalizers = [
    gs.normalizer.BoxCox,
    gs.normalizer.YeoJohnson,
    gs.normalizer.Modulus,
    gs.normalizer.Manly,
]
Let’s plot them!
fig, ax = plt.subplots(2, 2, figsize=[8, 8])
for i, norm in enumerate(normalizers):
    # correctly setting the data range
    x_rng = norm().normalize_range
    x = np.linspace(max(-5, x_rng[0] + 0.01), min(5, x_rng[1] - 0.01))
    for j, lmbda in enumerate(lmbdas):
        ax.flat[i].plot(
            x,
            norm(lmbda=lmbda).normalize(x),
            label=r"$\lambda=" + str(lmbda) + "$",
            color="k",
            alpha=0.2 + j * 0.1,
            dashes=dashes(j),
        )
    # axis formatting
    ax.flat[i].grid(which="both", color="grey", linestyle="-", alpha=0.2)
    ax.flat[i].set_ylim((-5, 5))
    ax.flat[i].set_xlim((-5, 5))
    ax.flat[i].set_title(norm().name)
# figure formatting
handles, labels = ax.flat[-1].get_legend_handles_labels()
fig.legend(handles, labels, loc="lower center", ncol=4, handlelength=3.0)
fig.suptitle("Normalizer Comparison", fontsize=20)
fig.show()
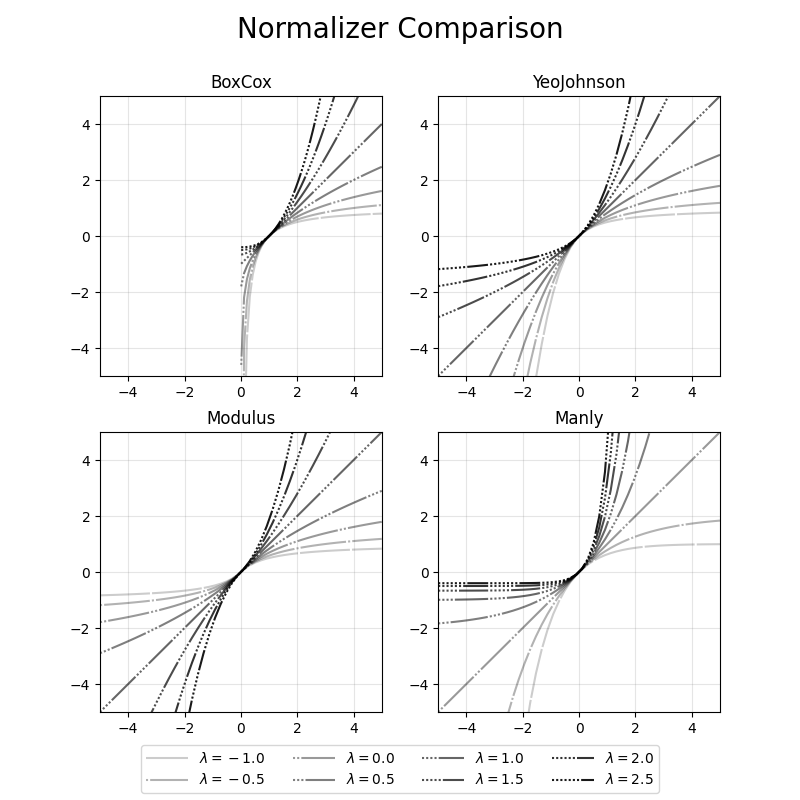
The missing LogNormal transformation is covered by the BoxCox
transformation for lambda=0. The BoxCoxShift transformation is
simply the BoxCox transformation shifted on the X-axis.
Total running time of the script: (0 minutes 0.171 seconds)