Note
Go to the end to download the full example code
Incorporating measurement errors
To incorporate the nugget effect and/or given measurement errors, one can set exact to False and provide either individual measurement errors for each point or set the nugget as a constant measurement error everywhere.
In the following we will show the influence of the nugget and measurement errors.
import numpy as np

import gstools as gs

# condtions
cond_pos = [0.3, 1.1, 1.9, 3.3, 4.7]
cond_val = [0.47, 0.74, 0.56, 1.47, 1.74]
cond_err = [0.01, 0.0, 0.1, 0.05, 0]
# resulting grid
gridx = np.linspace(0.0, 15.0, 151)
# spatial random field class
model = gs.Gaussian(dim=1, var=0.9, len_scale=1, nugget=0.1)
Here we will use Simple kriging (unbiased=False) to interpolate the given conditions.
krig = gs.Krige(
    model=model,
    cond_pos=cond_pos,
    cond_val=cond_val,
    mean=1,
    unbiased=False,
    exact=False,
    cond_err=cond_err,
)
krig(gridx)
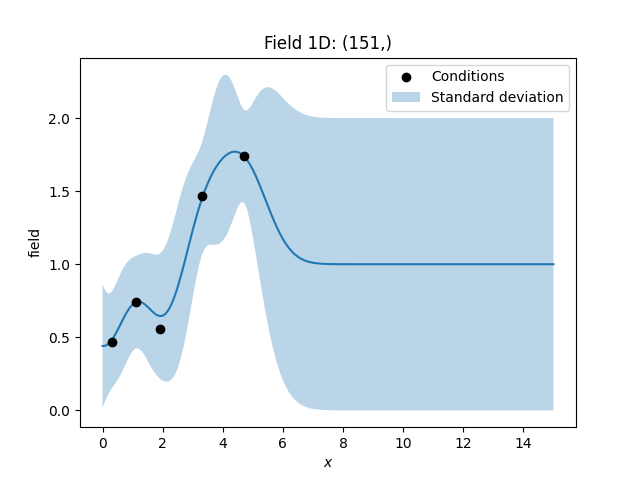
Let’s plot the data. You can see, that the estimated values differ more from the input, when the given measurement errors get bigger. In addition we plot the standard deviation.
ax = krig.plot()
ax.scatter(cond_pos, cond_val, color="k", zorder=10, label="Conditions")
ax.fill_between(
    gridx,
    # plus/minus standard deviation (70 percent confidence interval)
    krig.field - np.sqrt(krig.krige_var),
    krig.field + np.sqrt(krig.krige_var),
    alpha=0.3,
    label="Standard deviation",
)
ax.legend()

Total running time of the script: ( 0 minutes 0.165 seconds)