Note
Go to the end to download the full example code.
Multi-field variogram estimation
In this example, we demonstrate how to estimate a variogram from multiple fields on the same point-set that should have the same statistical properties.
import matplotlib.pyplot as plt
import numpy as np

import gstools as gs

x = np.random.RandomState(19970221).rand(1000) * 100.0
y = np.random.RandomState(20011012).rand(1000) * 100.0
model = gs.Exponential(dim=2, var=2, len_scale=8)
srf = gs.SRF(model, mean=0)
Generate two synthetic fields with an exponential model.
Now we estimate the variograms for both fields individually and then again simultaneously with only one call.
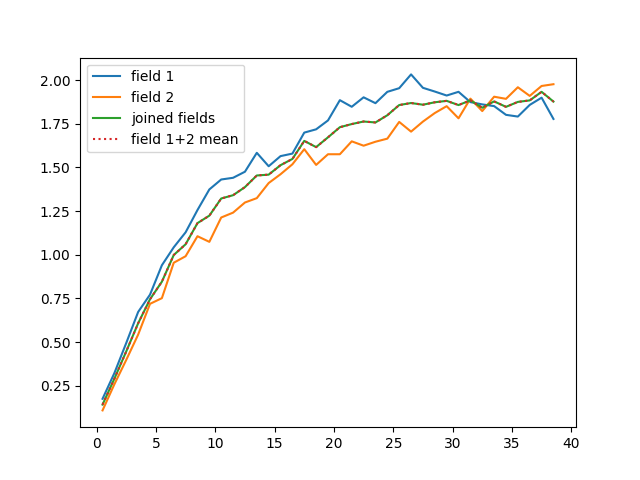
Now we demonstrate that the mean variogram from both fields coincides with the joined estimated one.
plt.plot(bin_center, gamma1, label="field 1")
plt.plot(bin_center, gamma2, label="field 2")
plt.plot(bin_center, gamma, label="joined fields")
plt.plot(bin_center, 0.5 * (gamma1 + gamma2), ":", label="field 1+2 mean")
plt.legend()
plt.show()
Total running time of the script: (0 minutes 0.706 seconds)