Note
Go to the end to download the full example code.
Finding the best fitting variogram model
import numpy as np
from matplotlib import pyplot as plt

import gstools as gs
Generate a synthetic field with an exponential model.
x = np.random.RandomState(19970221).rand(1000) * 100.0
y = np.random.RandomState(20011012).rand(1000) * 100.0
model = gs.Exponential(dim=2, var=2, len_scale=8)
srf = gs.SRF(model, mean=0, seed=19970221)
field = srf((x, y))
Estimate the variogram of the field with 40 bins and plot the result.
Define a set of models to test.
models = {
    "Gaussian": gs.Gaussian,
    "Exponential": gs.Exponential,
    "Matern": gs.Matern,
    "Stable": gs.Stable,
    "Rational": gs.Rational,
    "Circular": gs.Circular,
    "Spherical": gs.Spherical,
    "SuperSpherical": gs.SuperSpherical,
    "JBessel": gs.JBessel,
}
scores = {}
Iterate over all models, fit their variogram and calculate the r2 score.
# plot the estimated variogram
plt.scatter(bin_center, gamma, color="k", label="data")
ax = plt.gca()

# fit all models to the estimated variogram
for model in models:
    fit_model = models[model](dim=2)
    para, pcov, r2 = fit_model.fit_variogram(bin_center, gamma, return_r2=True)
    fit_model.plot(x_max=40, ax=ax)
    scores[model] = r2
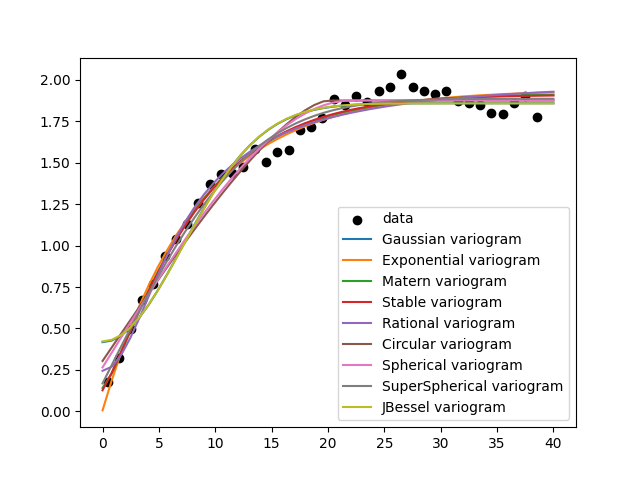
Create a ranking based on the score and determine the best models
RANKING by Pseudo-r2 score
     1.          Stable: 0.98218
     2.          Matern: 0.98176
     3.  SuperSpherical: 0.98141
     4.     Exponential: 0.98041
     5.        Rational: 0.97711
     6.       Spherical: 0.97334
     7.        Circular: 0.96725
     8.        Gaussian: 0.95928
     9.         JBessel: 0.95831
Total running time of the script: (0 minutes 0.536 seconds)